 Let’s say you have a bunch of datapoints and you want to come up with a nice model for them. We want this model to satisfy all the points in the best possible way. If we do this, then we will be able to use a mathematical formula to extract information about unknown points. At the same time, we should make sure that we don’t overfit our model to these datapoints. If we overfit our model, then it will tune itself too much to our datapoints and perform poorly on unknown data. So how we pick the best model? Where do we draw the line?
First of all, what’s this “model” you keep talking about?
Before we proceed, we need to understand what we mean by “model” in this context. Here, we are talking about a statistical model, which is basically a generalization of the observed data. Let’s take a very simple example to understand what this means. You randomly survey 1000 people from India and Brazil, and ask them what their favorite sport is. Once you have that information, you will obtain a set of values mapping those people to their favorite sport. Now, if you extract a statistical model from this data, you will see that people who like cricket are most likely from India and people who like football are most likely from Brazil. Bear in mind that this is a statistical model, which means it’s just a probability and not the absolute truth! Let’s say you want use this model to predict the nationality of a person based on his/her favorite sport. Now, you ask an unknown person what his favorite sport is and he says football. If you enter this value into your model, it will say that this person is most likely to be from Brazil.
This model seems fine to me! Why do we need to “pick” a model?
This is where things get interesting. The example we just discussed was a very simple example. We just considered a simple probability to see what’s more likely in that case. But real world is not so nice and simple! In the real world, we’ll have 10,000 questions and 200 countries. Now that’s a lot of data. We cannot use that simple model that will give us the right answer.
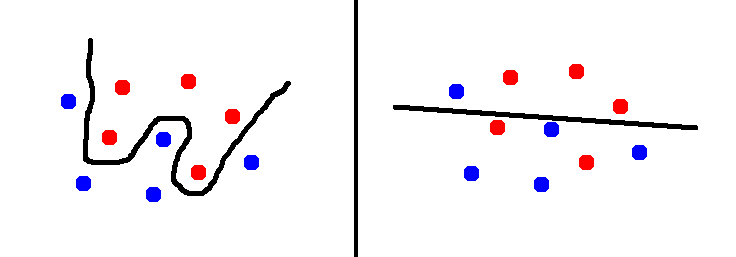 Consider the figure on the left. The curvy line separates the two sets of points really well. The accuracy is high and we are all happy. But the set of datapoints we have is a small set. This means that we don’t really know what the real world data actually looks like. We just hope that these points are good enough to be representative of the real world data and build a model based on that. So if we fine-tune it too much by making it very curvy, we might actually perform really badly on unknown data.
On the other hand, the straight line separator might generalize very well because we are not fine tuning it at all. But at the same time, it doesn’t really separate the two sets of points that well. So the best answer lies somewhere between these two extremes. There are a lot of models between these two extremes. The question is, how do we evaluate these models and pick the best one?
Say hello to Bayesian Information Criterion
This is where Bayesian Information Criterion (BIC) comes in handy. It is a method to choose the best model among a finite set of models. As we add more parameters to a model, the accuracy increases. But at the same time, it will also increase the chances of overfitting. So BIC solves this problem by penalizing the “curviness” of a model. That way, we are not blindsighted by the accuracy provided by a particular model. We will not be going into the mathematical details of BIC, because that’s not why we are here. We just want to understand how it selects the best model. Let’s see if we can do that without any equations. Having said that, the mathematical formulation is actually really nice. So if you want to take a peek, go ahead and google it. It’s a lot of fun!
The curviness of a model depends on the number of parameters we add to that model. So in order to select the best model, we need to define a function which takes this into account. BIC can basically measure the efficiency of a model in terms of its ability to predict the data. BIC is defined in terms of the likelihood function, the number of parameters, and the number of datapoints. The model with the lowest BIC is the best one. So once we build a set of models, we evaluate the BIC for each of them and pick the one with the lowest BIC.
———————————————————————————————————
