 Let’s say you get a whole bunch of data samples and you want to do some analysis about the underlying structure of those samples. You know that they can be categorized into certain groups, but you are not exactly sure what those categories are. For example, you get the data associated with shopping behavior of consumers. You want to understand what products are more popular, what kind of consumers buy these products, what time of the year do consumers buy more, etc. In order to divide this data into subgroups, we need to know what those groups should be in the first place. In our case, we don’t! This becomes increasingly difficult as you get more samples, often ranging in hundreds of thousands. So how do we analyze this data? How do we make the machine automatically learn the underlying structure and categorize accordingly?
How do we solve this problem?
First of all, we should understand that this is a machine learning problem. We have a lot of data and we want our machine to analyze it automatically without human supervision. Say hello to K-means clustering! It is one of the simplest unsupervised learning algorithms that solves our problem here. The procedure follows a simple and easy way to classify a given data set through a certain number of clusters. Before we begin, we assume that we have ‘k’ number of clusters in our data. This should explain why it’s named K-Means! This algorithm is used in a wide variety of applications ranging from computer vision, statistics, natural language processing, robotics, etc.
So how does it work?
The main idea here is to define ‘k’ centroids initially, one for each cluster. The good thing is that it doesn’t really matter how you these initial ‘k’ centroids, the algorithm will eventually converge to the right ones. One strategy that is often used is that they are placed as far away as possible from each other. The next step is to take each point and associate it to the nearest centroid. After you associate every data point with a centroid, the first round of clustering is done.
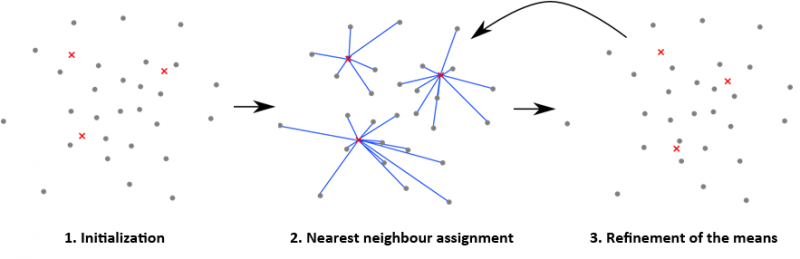 At this point we need to re-calculate ‘k’ new centroids as new centers of the clusters resulting from the previous step. Now why do we need this step? Well, because the centroid we chose earlier might not be the centroid of the points that were associated with it. We always want the centroid of the cluster we are analyzing. After we have these k new centroids, a new binding has to be done between the data points and the nearest new centroid. This step will help us bring misclassified points into the right cluster. As a result of this, we may notice that the k centroids change their location step by step until no more changes are done. In other words centroids do not move any more.
How do we know how good or bad the clustering is?
At the end of this algorithm, we will have ‘k’ groups in our data, with one center point associated with group. The algorithm thinks that this is the best way to separate the groups. Now we calculate the distance of each point with its associated center point and sum all these distances. This sum gives an estimate of how good the grouping is. As in, if we move one datapoint to some other cluster, then this distance should increase because that point doesn’t belong to the new cluster. This sum gives an estimate of how good we clustered the data.
————————————————————————————————-
