 Let’s say you are a part of the sub-atomic physics team and you are working on discovering an important effect. The thing about sub-atomic physics is that nothing is certain and you cannot say something has happened with 100% certainty. The best we can do is to say that we are x-percent sure that something interesting happened. One fine day, you see some pattern in your data which looks pretty much like what that effect would look like. Now the problem is, your experiment produced data with a lot of noise. People are therefore skeptical of you, and think that the supposed “effect” you claimed to see might just have been a funny pattern in some random noise. How would you convince them that it’s not? Before that, how do you convince yourself that it’s not just noise? A good strategy for arguing your point would be to say, “Alright listen, suppose you’re right, and the patterns in my data really are in fact just from random noise, then how would you explain the fact that random noise very rarely produces patterns like this?”. Pretty good strategy right? Now how do we formulate this mathematically?
Why p-values?
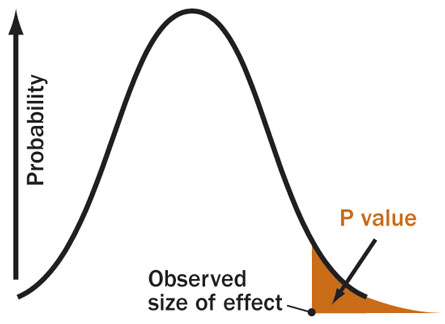
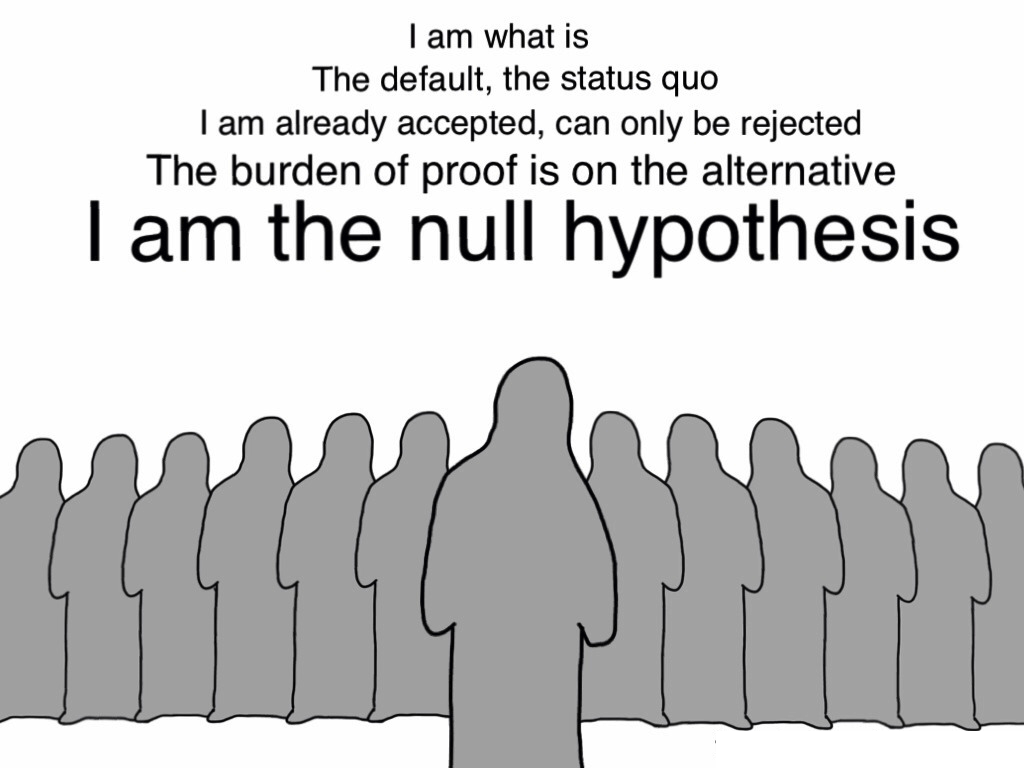 P-values quantify the above argument in a nice mathematical way. P-value is short for Probability Value. In the example above, the p-value would be the probability that you would see a pattern if it was just random noise. So ideally, a high p-value would indicate that the pattern was probably due to random noise. A low p-value would indicate that the pattern was produced due to that effect. More generally, a p-value is the probability that you would observe something very extreme, something like a big coincidence. To formulate this, we use a concept of null hypothesis saying that “nothing interesting is going on”. Wait, what is “null hypothesis”? Null hypothesis corresponds to saying “Alright listen, suppose you’re right, and the patterns in my data really are just from random noise”, which the first part of our strategy discussed earlier.
Now, the definitions of “extreme” and “nothing interesting is going on” depend on the underlying problem we are trying to solve. Thus small p-values indicate that whatever you saw would be very unlikely under the null hypothesis (“nothing interesting”), and so suggest that the null hypothesis is implausible. For readers with more mathematical proclivity, you can think of p-values as sort of quantifying a proof by contradiction argument, where we begin by assuming the null hypothesis is true, and show how it leads to an implausibility.
Why is it relevant?
 When you perform a hypothesis test in statistics, a p-value helps you determine the significance of your results. Hypothesis tests are used to test the validity of a claim that is made about a population. For example, you want to manufacture suits for the large group of people. Measuring millions of people individually would obviously be very expensive. So you just take a small subset, say 100 people, and measure them. Based on that, you make a general inference about the rest of the million people. The claim that’s on trial in our case is called the null hypothesis. The null hypothesis is equivalent to your fellow scientists not believing that you found the effect we talked about earlier. The alternative hypothesis is the one you would believe if the null hypothesis is concluded to be untrue. The evidence in the trial is your data and the statistics that go along with it. All hypothesis tests ultimately use a p-value to weigh the strength of the evidence (what the data is telling you about the population). The p-value is a number between 0 and 1 and interpreted in the following way:
- A small p-value (typically ≤ 0.05) indicates strong evidence against the null hypothesis, so you reject the null hypothesis. This means that something interesting is going on and it’s not just noise!
- A large p-value (> 0.05) indicates weak evidence against the null hypothesis, so you fail to reject the null hypothesis. Although p-value is still in our favor, we cannot conclusively say that it was not due to random noise.
- p-values very close to the cutoff (0.05) are considered to be marginal (could go either way). If you carefully read good papers on these kind of topics, you will always see the p-values being reported so that the readers can draw their own conclusions.
An example
Let’s say that a pizza place claims their delivery times are 30 minutes or less on average. Now you think it’s more than 30 minutes. You conduct a hypothesis test because you believe the null hypothesis, that the mean delivery time is 30 minutes maximum, is incorrect. This means that your alternative hypothesis is that the mean time is greater than 30 minutes. You randomly sample some delivery times and run the data through the hypothesis test, and your p-value turns out to be 0.01, which is much less than 0.05.
 In real terms, there is a probability of 0.001 that you will mistakenly reject the pizza place’s claim that their delivery time is less than or equal to 30 minutes. Since typically we are willing to reject the null hypothesis when this probability is less than 0.05, you conclude that the pizza place is wrong; their delivery times are in fact more than 30 minutes on average, and you want to know what they’re going to do about it! Of course the statistics can come and bite you because you could be wrong by having sampled an unusually high number of late pizza deliveries just by chance. Well, this is where we enter the philosophical discussion about the agony and ecstasy of using statistics! Mark Twain once famously said, “There are three kinds of lies: lies, damned lies, and statistics”.
Is it useful?
 You will be really surprised at how often p-values are used in our daily lives. You can read any scientist’s work, not knowing anything about their field, and still understand what they’re saying when they quote a p-value. This indicates the confidence level of their experiments. You can find any statistical test, not know anything about how it works internally, but still know how to interpret the p-value it gives you. This level of generality is relatively rare, and that makes it precious a gem within the field of Statistics. P-values are absolutely ubiquitous in Statistics, and the social and natural sciences. For many scientific journals, obtaining a low p-value is essentially a requirement for getting published. They are so important that p-values are sometimes called the “Statistician’s stamp of approval”.
————————————————————————————————-
