 I was recently working on a machine learning problem when I stumbled upon an interesting question. I wanted to build a machine learning model using a labeled dataset that can classify an unknown image. It’s a classic supervised learning problem! I was not exactly sure how the model would turn out, so I had to experiment with a bunch of things. If I fine tune the machine learning model too much, then it will be very specific to my training data and it won’t generalize well. If I keep it too simple, then it might generalize well but it won’t detect all the underlying patterns in my training data. How do I know if my training data is generic enough? What issues can cause my machine learning model to be sub-optimal?
What exactly is the problem here?
When you are working with machine learning models, you need to understand all the different sources of error. You can then attempt to minimize them so that your final model looks great! Let’s consider a simple machine learning problem of estimating the average income of a person based on the geographical location and educational background. Obviously, you cannot go out and get the information about every single person. That’s too much work! So you just gather this information from, say, 1000 people and then use this information to extract a “formula”. This extraction process is called “training” in machine learning lingo. You can then use this formula to estimate the income of any unknown person.
The approach we just discussed is called “supervised learning”. Why is that? Because you provide the inputs i.e. geographical location and educational background, and the corresponding output i.e. the income of that person, to your machine learning model. You do this for all the 1000 people. Now your model will extract a relationship between the 2 input variables and 1 output variable. This model is only an estimate and it doesn’t represent the true formula. To get the true formula, you need to gather information from every single person in the world. That’s obviously not going to happen! We can only estimate something that’s as close as possible to this real formula. So what are the sources of error that are stopping our model from being perfect?
Understanding the sources of error
The difference between our model’s prediction and the actual value is called “error due to bias”. Let’s call this ‘X’. We want this to be as low as possible, right? We want our prediction to be as close as possible to the real value. Let’s say we repeat the above experiment with a different set of 1000 people and build a new model. Now this model is going to predict an output (i.e. average income) for given values of input variables (i.e. geographical location and educational background). This output will not be exactly equal to the actual value. Let’s call this difference ‘Y’. Here, ‘Y’ would be the “error due to bias” of the second model. X will not be equal to Y.
If you repeat the experiment a bunch of times and measure the output for the same set of input values, you can see how the values will fluctuate. If all the values are close to each other, then we can say that the variance is low. Bear in mind that these values need not be close to the true value. They can be far away from the true value and still be close to each other. This spread in values is called “error due to variance”. So in an ideal world, we want the errors due to bias and variance be low. This means that:
- We want the output values as close as possible to the true value, which demonstrates accuracy
- We want those output values to be close to each other, which demonstrates consistency
A picture is worth a thousand words
Well, to be fair, we have only been through a couple of hundred words till now! But anyway, why talk when we can just visualize, right? People tend to use this classic bulls-eye diagram to discuss bias vs variance in machine learning:
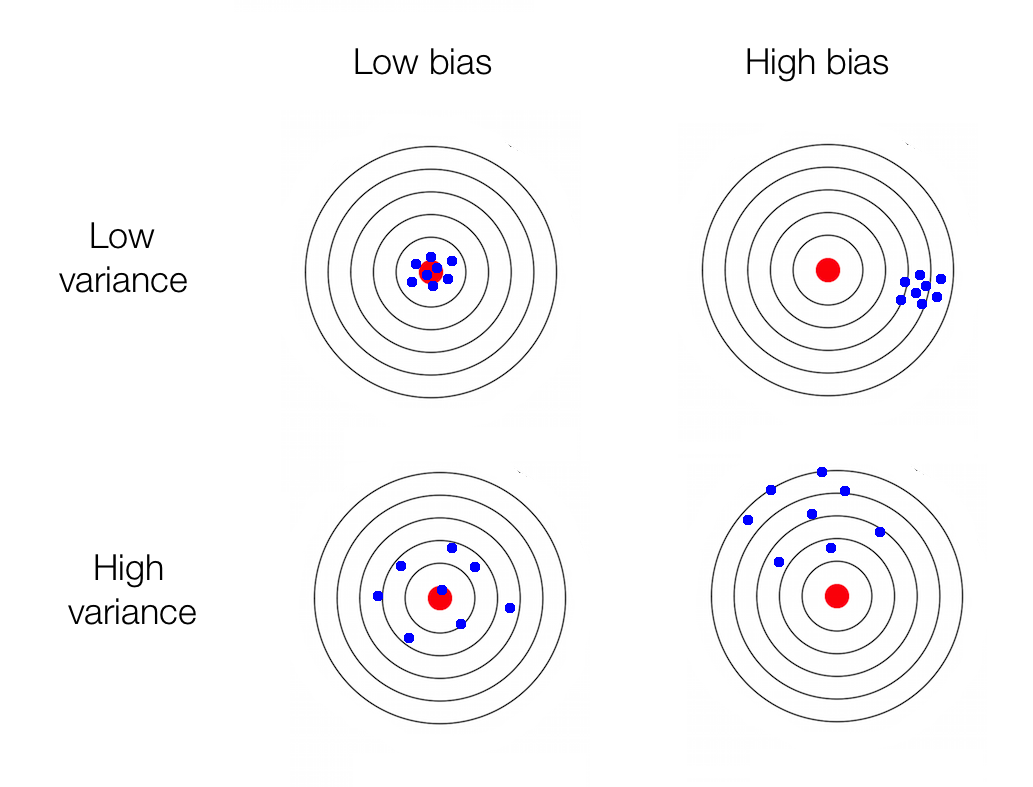 As we can see, the points are very close to each other in the first row. They are tightly knit, which indicates low variance. In the first column, the points are centered around the bulls eye, which indicates low bias. In real life, we wouldn’t know where the real bull’s eye would be. We basically construct a bull’s eye target using a finite dataset and build our world around that hoping that the real bull’s eye would be somewhere close. Training our machine learning model is like calibrating a bow and arrow to hit the target accurately.
So what does it mean?
As we can see, it’s a trade-off game here. We want low bias and low variance, but it’s difficult to attain. So the bias vs. variance analysis is a way of understanding our algorithm’s abilities to generalize well. Using this analysis, we can understand our algorithm’s expected generalization error. It’s an attempt to find an answer to questions like “Will my algorithm perform well on unknown data?” and “Will my algorithm be consistent across different types of data points?” This tradeoff usually applies to all supervised learning problems like classification, regression, etc.
———————-———————-————————————————————-

I am so glad I came across this neat problem. If you add the reblog button, I would be happyy 🙂 to re-blog this. I found a nice way out, given how supervised models work 🙂 Awesome post 🙂
Thanks 🙂
Very useful information and nicely explained.