 Image classification is one of the classical problems in computer vision. Basically, the goal is to determine whether or not the given image contains a particular thing like an object or a person. Humans tend to classify images effortlessly, but machines seem to have a hard time doing this. Computer Vision has achieved some success in the case of specific problems, like detecting faces in an image. But it has still not satisfactorily solved the problem for the general case where we have random objects in different positions and orientations. Bag-of-words (BoW) model is one of the most popular approaches in this field, and many modern approaches are based on top of this. So what exactly is it?
First of all, what do you mean by “words”? Aren’t we talking about images here?
We are in the realm of computer vision, which means we are dealing with images and videos. So you might be wondering why we have “words” here. The thing is that the concept of BoW is actually taken from text analysis. People started working on text much before they started working on images. The BoW concept for text analysis becomes relevant when we are dealing with a large number of documents.
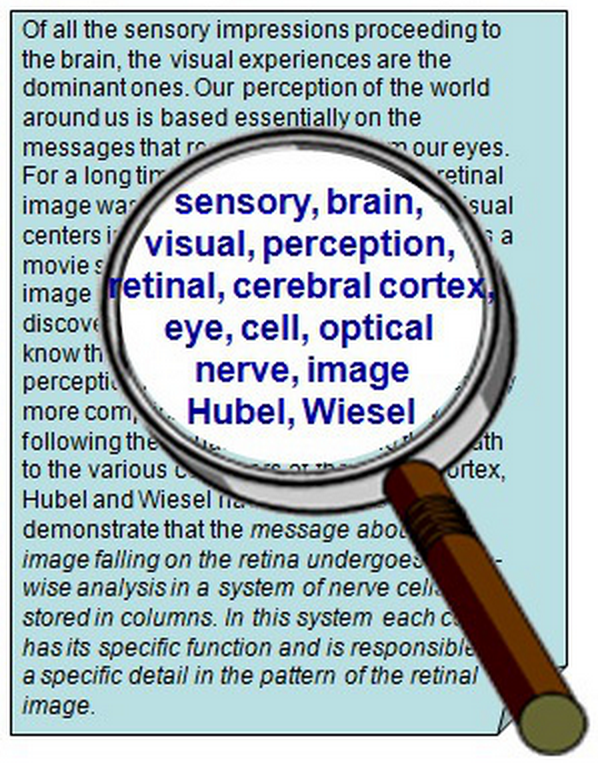 Whenever you want to retrieve something from a big database, possibly containing millions of documents, you need perform a quick and efficient search. You cannot compare every single word in each document with every single word in all the other documents. It’s slow and inefficient! So people came up with BoW model. Here, the idea is to represent a document as a “bag” of important keywords, without considering the order of these words. That’s the reason we call it “bag of words”, and not an “ordered list of words”. Note that we only consider the important keywords, which means that words like “on”, “it”, “the”, etc get discarded because they don’t give us much information. This piece of information will become relevant very soon! Let’s move on images, shall we?
How do we use this concept in computer vision?
The idea is very similar in computer vision too. We represent an object as a bag of “visual words”. These visual words are basically important points in the images. These points are called “features”, and they are discriminative. What this means is that a big patch of monotonic region is not considered to be a feature because it doesn’t give us much information. This is in contrast with a sharp corner or a unique color combination, where we get a lot of information about the image. We can use the BoW model for image classification by constructing a large vocabulary of many visual words and represent each image as a histogram of the frequency words that are in the image. To actually use BoW for image classification, we need to extract these features, generate a codebook, and then generate a histogram. Wait a minute, how do we do that? Okay, may be I skipped a couple of steps there. Let’s go over these steps in detail.
How do we extract the features?
The first step here is to identify those important points in an image. Once we know where they are, we can start the extraction process. A good feature will be robust against things like intensity, rotation, scale, etc. To understand this, let’s say we have an image that contains a chair. We have another image where we also have a chair, but it looks smaller and it’s upside down. If we ask a human to identify what it is, he will do it very quickly, even though the chair looks smaller and is upside down. We want our machines to be able to do this too.
A feature basically represents a very small region in an image. This region, also called “patch”, should be unique and discriminative. Feature representation methods deal with the problem of representing these patches with a vector of numbers. These vectors are called feature descriptors. One of the most famous descriptors is Scale-Invariant Feature Transform (SIFT). SIFT converts each patch into a 128-dimensional vector. After this step, each image is a collection of vectors of the same dimension, where the order of different vectors is not important.
Generating the codebook
 Before we talk about generating the codebook, we need to understand what exactly a codebook is. A codebook is basically like a dictionary. It’s like you have a dictionary of something, and every new object that comes in is mapped to one of the categories you already have. A good example would be categorization of human population based on cities. You codebook consists of a list of cities, and everyone who comes in will be categorized as a resident of one of these cities. The codebook consists of codewords. A codeword is analogous to a city in our example.
So once we extract all the features from all our training images, we are ready to build our codebook. One simple method to do this is by using K-Means Clustering. This basically groups all the features together and extracts the representative centroids. Codewords are then defined as the centroids of these clusters. The number of the clusters is the codebook size. Hence, each patch in an image is mapped to a certain codeword through the clustering process.
How do we do the actual classification?
Now, we have mapped each feature in these images to a certain codeword. The next step is to represent each image with something. The whole reason we are doing this is because we cannot use the entire image to the comparison. It’s too slow! So we are building something that’s stronger and faster. If you consider all the pixels and their values in an image, we get millions of numbers. We want to reduce that to a very small size. To do this, we need to map all those random numbers to something we already know. It’s like rounding off all those floating point numbers to whole numbers. So instead of storing all those feature vectors, we get the closest one in our dictionary and store the index to that.
Let’s consider our earlier example of categorization of human population based on cities. If we have only two cities, say San Francisco and Los Angeles, in our dictionary to represent the state of California, it will be inaccurate. There are many different cities in this state, and if we just pick the closest city to each person’s residence, we will be missing out on all the information. On the other hand, if we consider every single city in California, there will be too much data and the process will be too slow. So we need to find a good balance and pick strategic cities located across the state so that we can capture all the variations, whilst minimizing the amount of data we need to store.
The reason for doing this is that it consumes very little space, and if we are have enough number of words in our dictionary, we don’t end up losing a lot of information. The image is now represented by the histogram of the codewords. This histogram basically counts the number of times each codeword has appeared in the given image. We use this to categorize every new image that comes in by computing the Euclidean distance.
—————————————————————————————————————————————————————

Thanks for the nice tutorial! Keep it up.
Thanks! Glad you found it helpful.
Best tutorial …it really worked for me.
How easily the concepts are explained.
how is BOG different from VLAD?
Best tutorial on BoW